File:ComptonCentralRateExamplePlot.png
From PREX Wiki
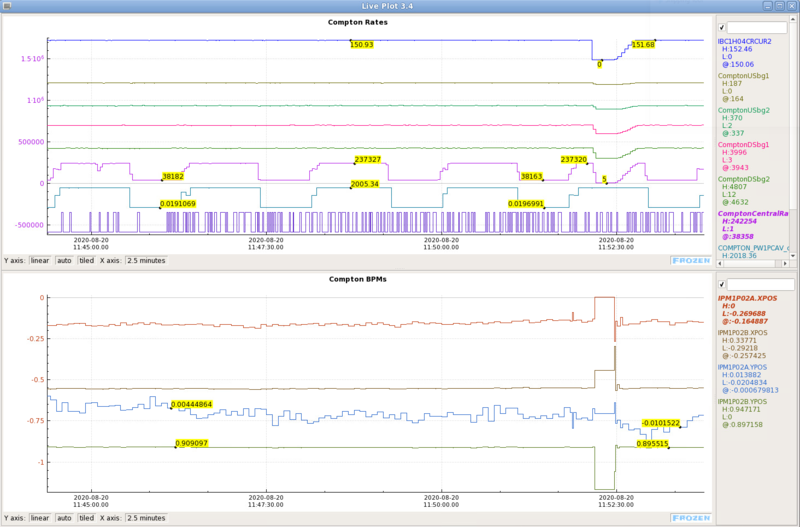
Revision as of 11:59, 20 August 2020 by Ajzec (talk | contribs) (An example plot showing what the rates liveplot should look like when you load up CREX/ComptonRatesAJZ. The important thing is here in the ComtponCentralRate trace that it is maximum when the laser is locked and the beam current is up. When the laser u...)

Size of this preview: 800 × 527 pixels. Other resolutions: 320 × 211 pixels | 1,464 × 964 pixels.
Original file (1,464 × 964 pixels, file size: 329 KB, MIME type: image/png)
An example plot showing what the rates liveplot should look like when you load up CREX/ComptonRatesAJZ. The important thing is here in the ComtponCentralRate trace that it is maximum when the laser is locked and the beam current is up. When the laser unlocks we receive some 10's of kHz in background, and when the beam trips, the rate mostly drops to zero regardless of laser state. If these behaviors aren't immediately manifest then we are likely missing the laser.
File history
Click on a date/time to view the file as it appeared at that time.
| Date/Time | Thumbnail | Dimensions | User | Comment | |
|---|---|---|---|---|---|
| current | 11:59, 20 August 2020 | | 1,464 × 964 (329 KB) | Ajzec (talk | contribs) | An example plot showing what the rates liveplot should look like when you load up CREX/ComptonRatesAJZ. The important thing is here in the ComtponCentralRate trace that it is maximum when the laser is locked and the beam current is up. When the laser u... |
You cannot overwrite this file.
File usage
The following page uses this file: